Back to Main Page
Historical Charts
I apologize to the original sources of these but I don't recall where I got them over the years. This is just a collection of charts I found worth keeping over the years
Charts of Reference
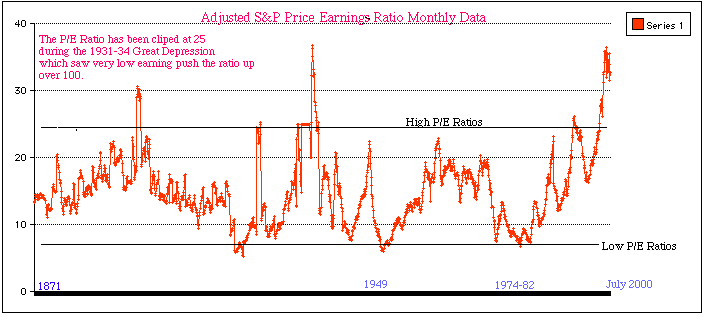
PE ratios 1871 - 2000
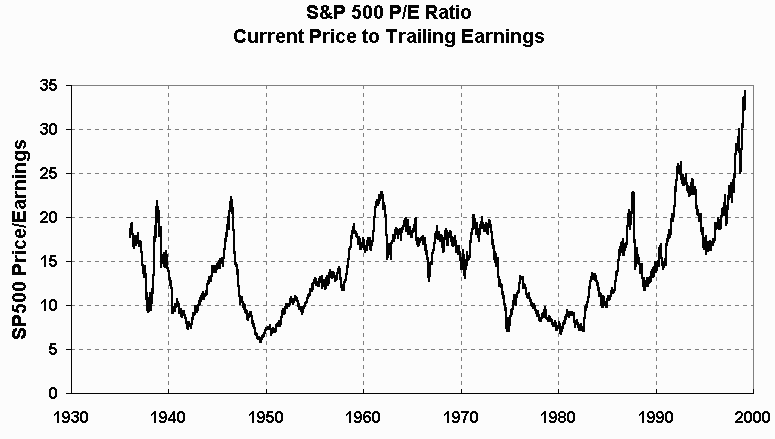
PE ratios 1935 - 2000
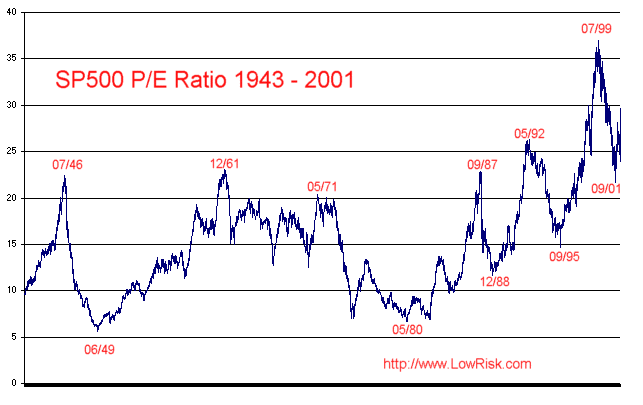
PE ratios from 1943 to 2000
DOW History 1895 to 1999 with comments of what was happening in history at the time
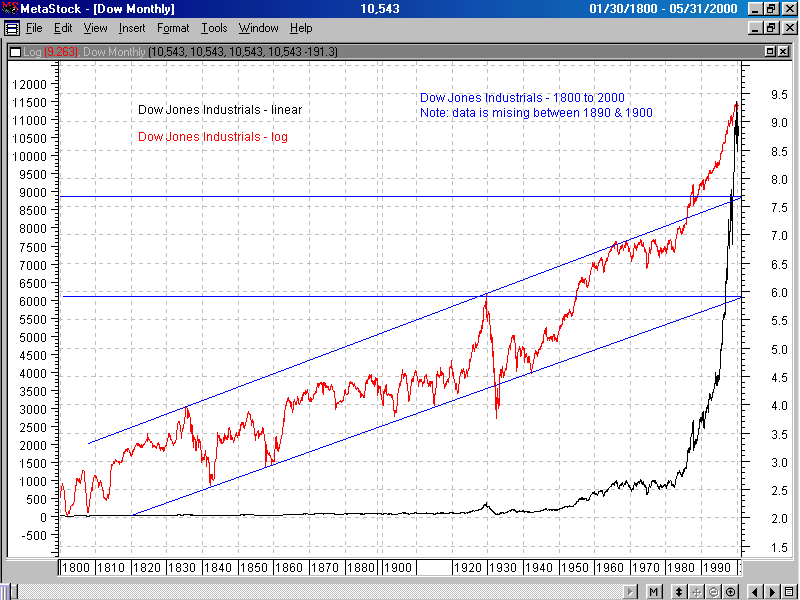
dow1800to2000log.png
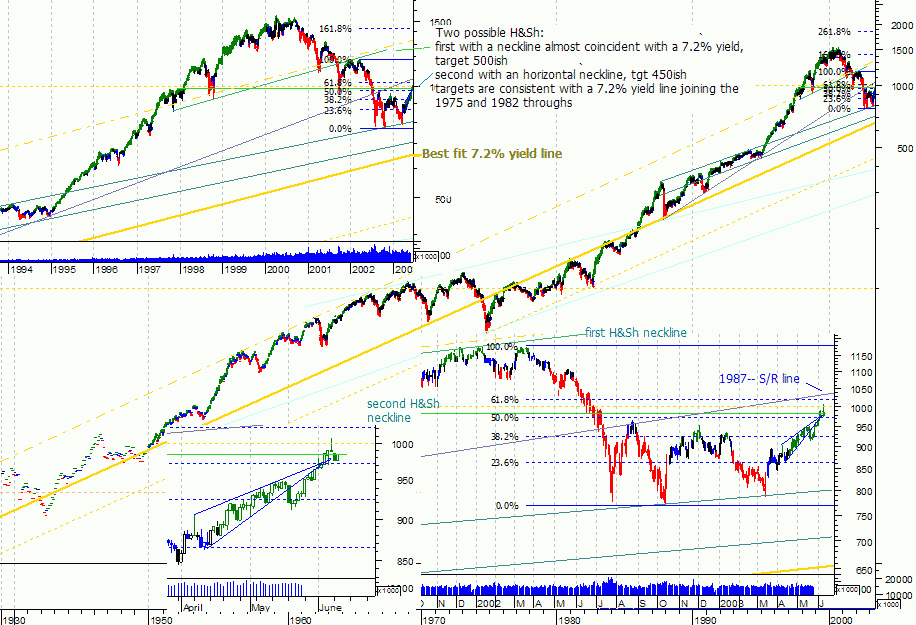
spxlongterm.png
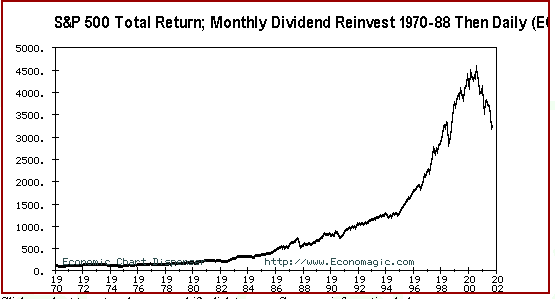
SPX total return 1970 - 2001 with dividends reinvested
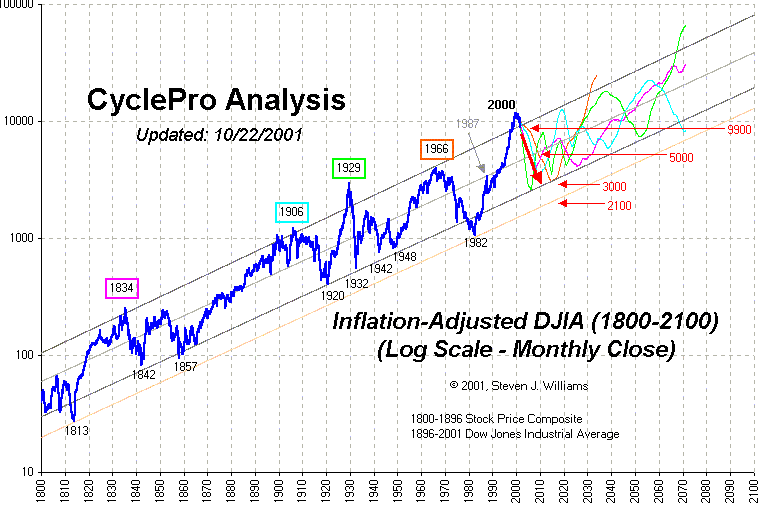
Inflation adjusted DOW jones.gif
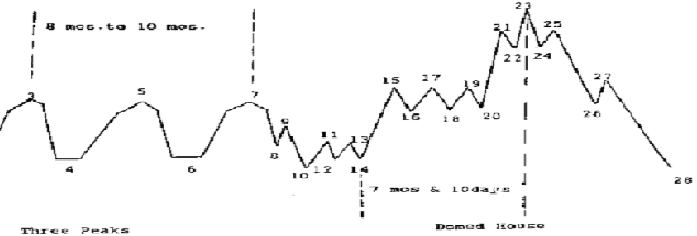
3 Peaks and a Domed House Pre-crash formation
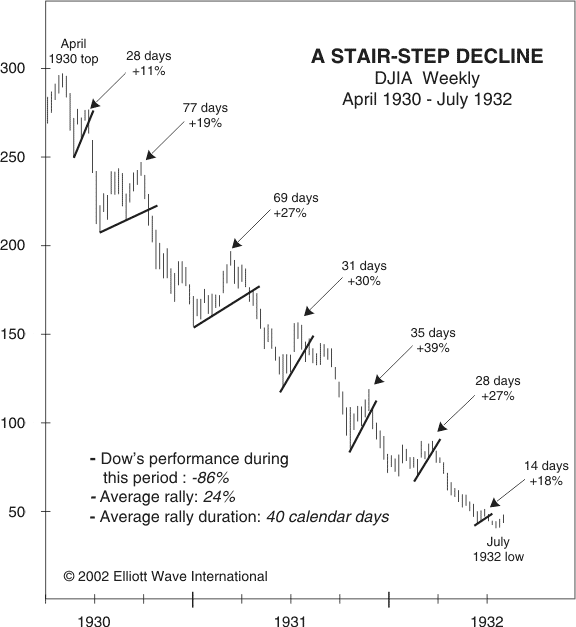
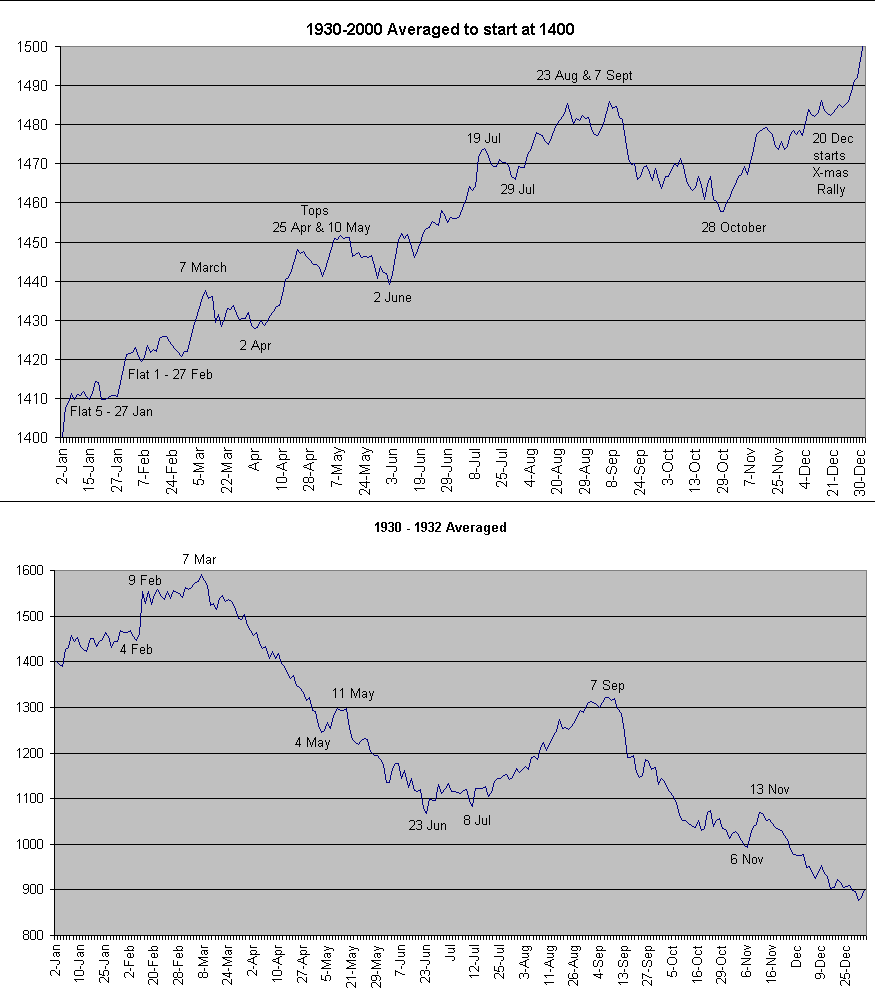
dow 1930 - 1932
Another 1930 - 1932 Chart
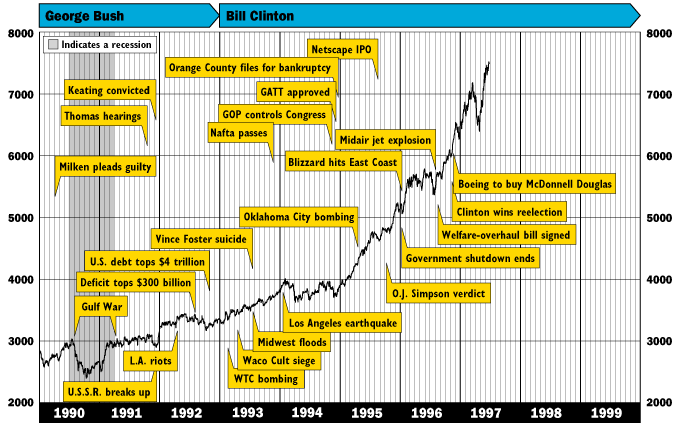
1990 - 1999 With Comments
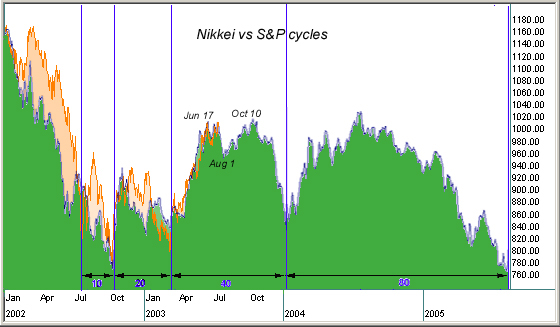
Nikkei vs SPX overlay as of July 2003.jpg
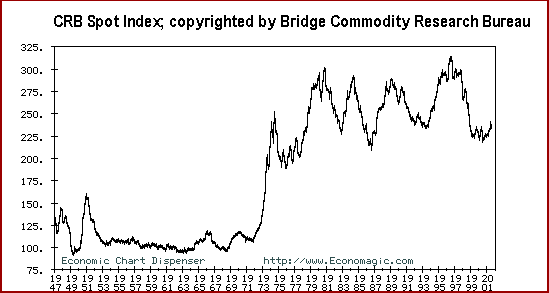
CRB Index from 1947 to 2001
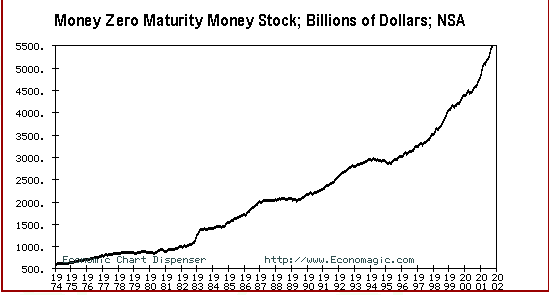
MZM from 1974 to 2001
Personal Savings 1959 - 2001
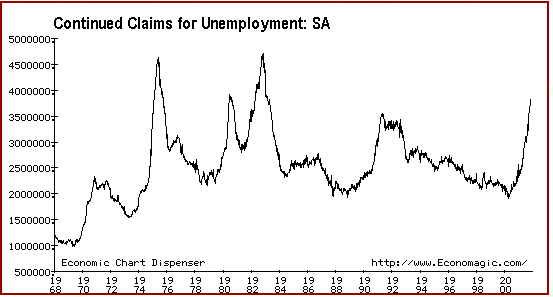
unemployment 1968 - 2001
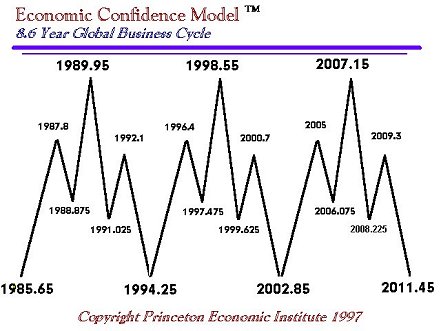
business cycle 8.6 year
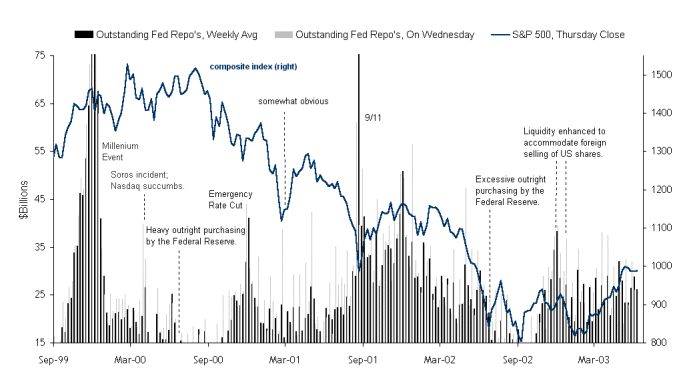
Temporary Market Operations 99 on with Overlay.gif
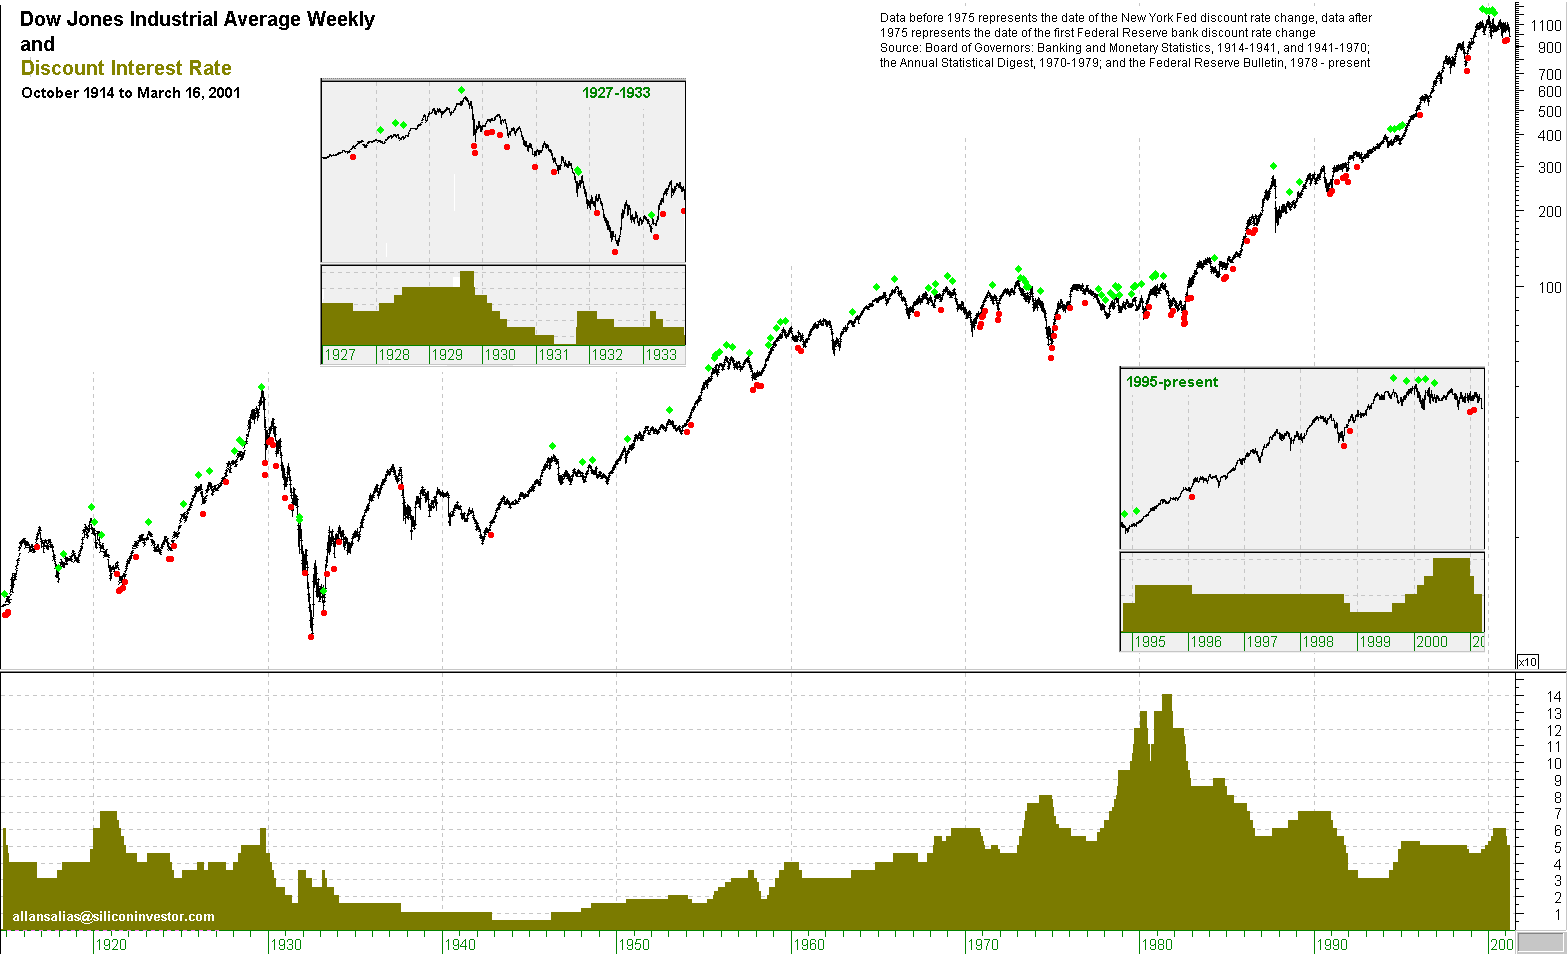
DOW_INDU_vs_Rate_Cuts_Long_Term.gif<
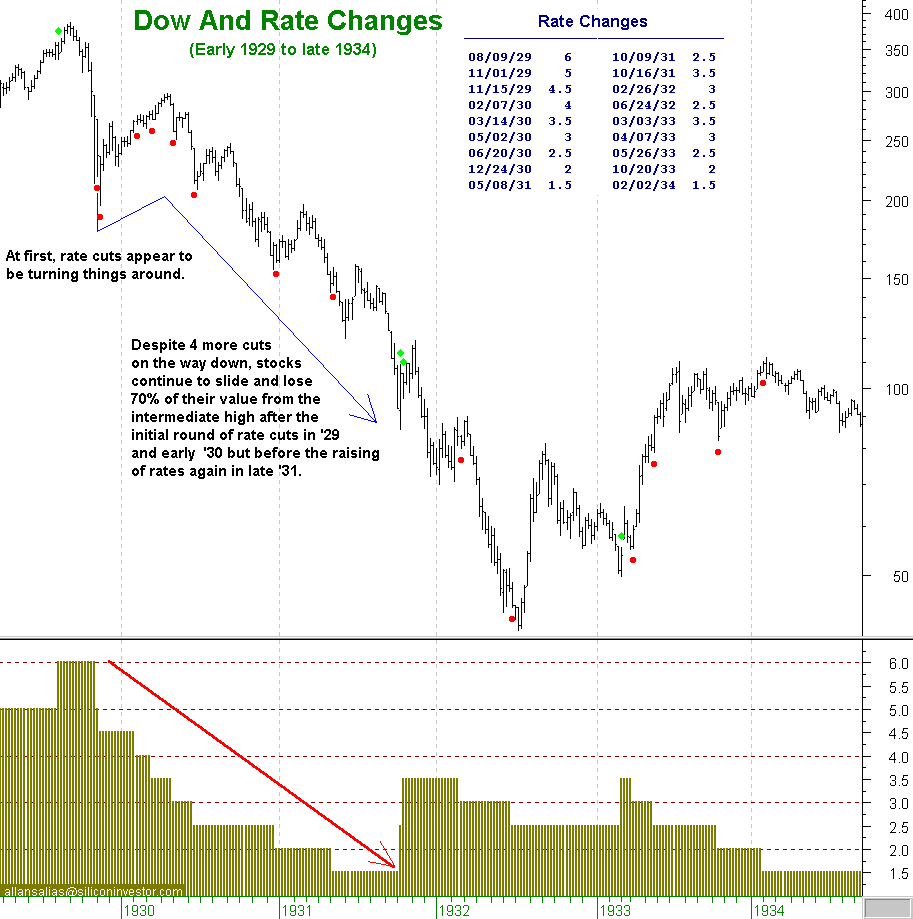
DOW_INDU_vs_Rate_Cuts_1929_1934
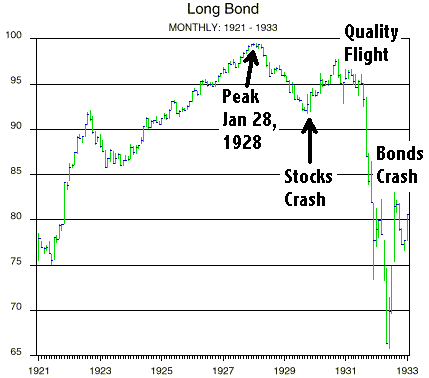
USBond29.gif
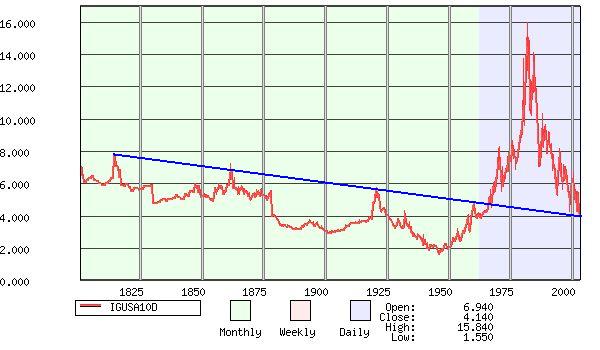
10yInterest1800.jpg
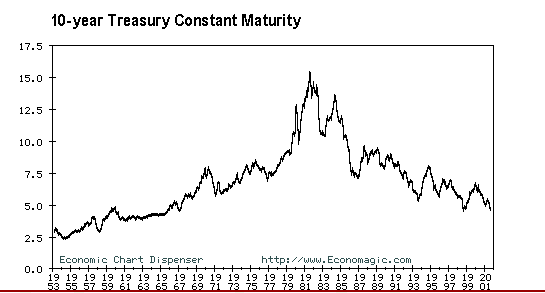
10 year Rate 1953-2001
supercycles 2010