Seasonal Patterns of Trading


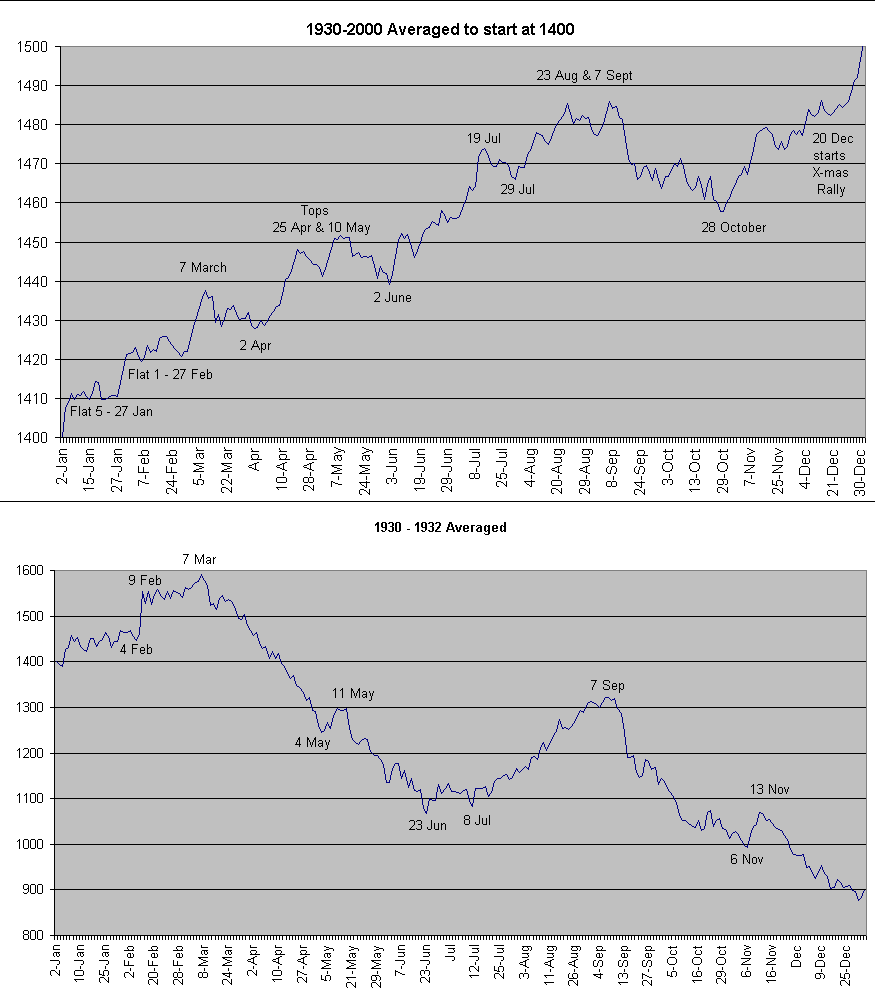
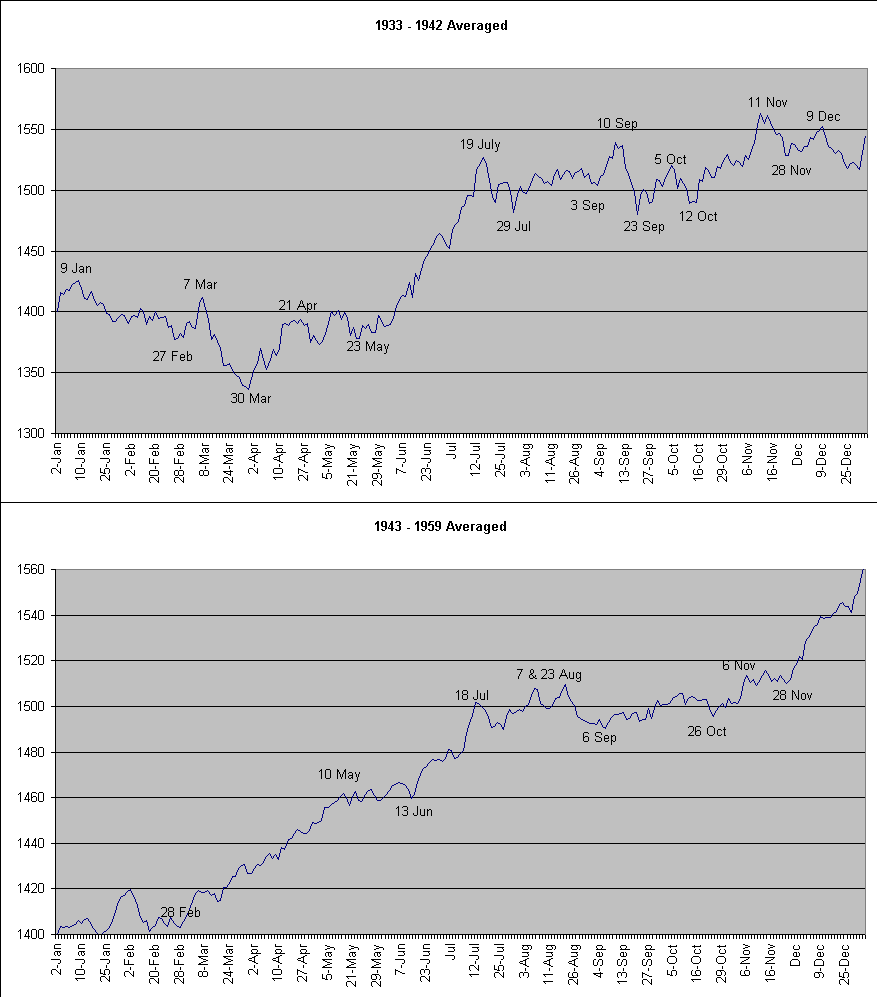
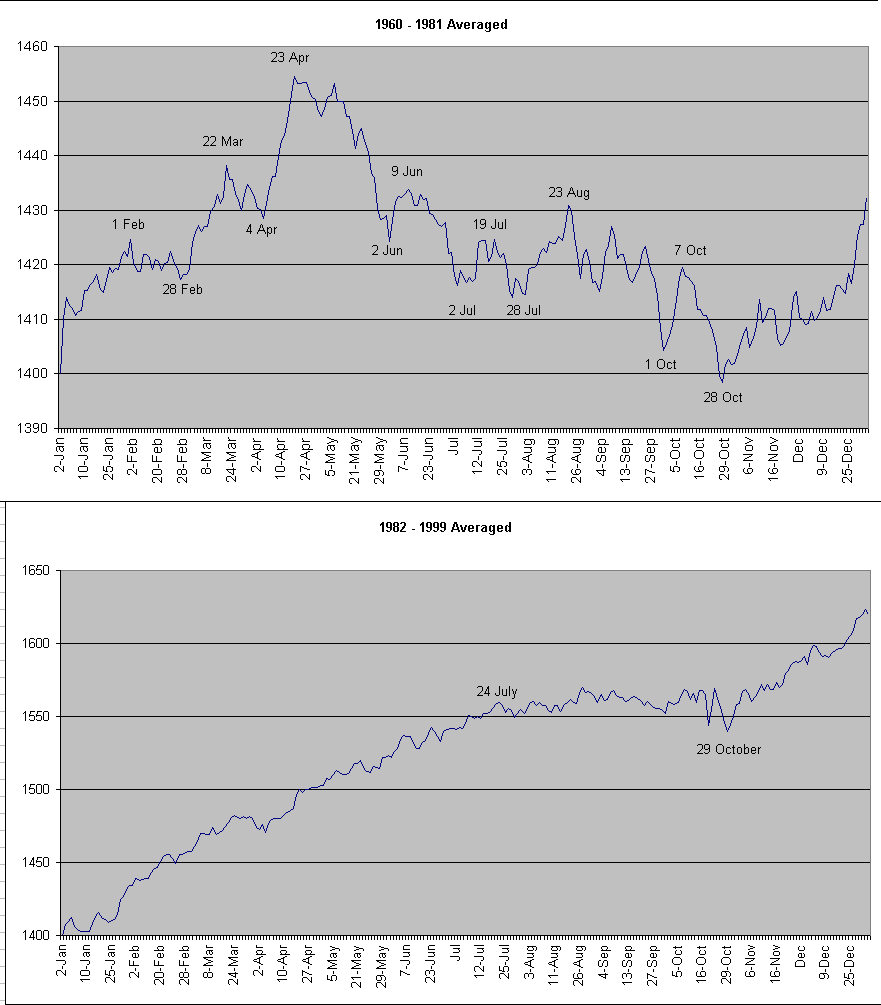
These are the corrected charts under the same concept as earlier. Donald pointed out that higher market would skew the data averages so I corrected for that. The Long term average of teh DOW came out at around 1400 so all charts were multiplied by a correction constant that made each January 2nd start at 1400. Looking at long term charts, the periods were then chosen based on bearish, flat or bullish periods and the results are shown here.
Note the constant recurring 28 October Date in all but true bear markets. Buying on 28 October would yield the best returns while shorting in July and September gave best returns for shorts.


